The Put/Call Ratio Needs a Denominator and Context
Option volume can indicate demand for protection or speculation. A ratio alone does not establish traders' intentions or forecast a reversal.
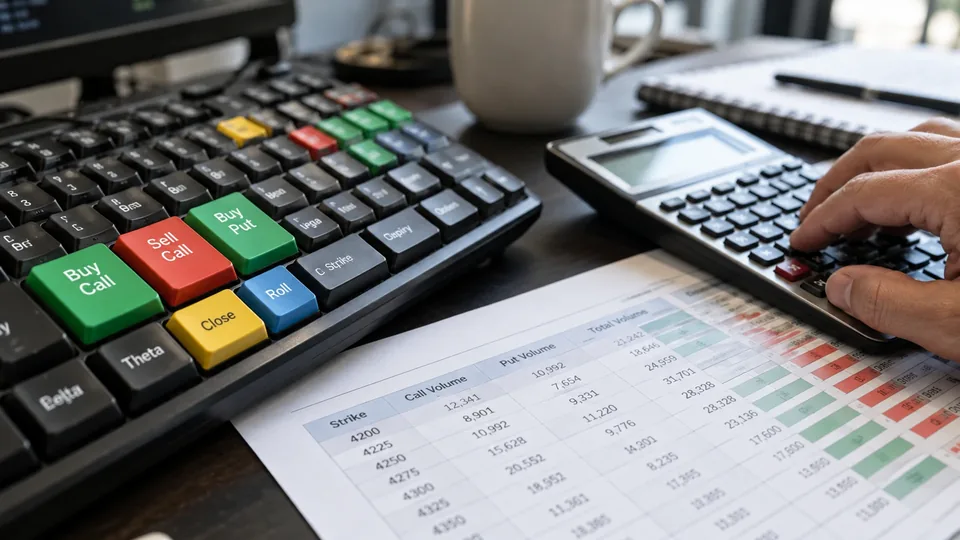
The put/call ratio compares the number of put-option contracts traded with the number of call contracts traded over a defined period. It offers a compact description of activity, which is why it appears so often in market commentary. The difficulty begins when that description becomes a confident claim about what investors believe.
Puts and calls can be used for protection, income, speculation or combinations of those purposes. A high ratio may coincide with demand for downside insurance, but the count alone does not identify the initiator, motivation or complete position behind each trade.
Start with the numerator and denominator
For a volume-based measure, divide put volume by call volume. In a hypothetical session with 600,000 puts and 1 million calls, the ratio is 0.60. That means 60 put contracts traded for every 100 calls. It does not mean that 60% of investors were bearish, because contracts and investors are different units.
The denominator can move the ratio even if put trading does not change. If calls fall to 500,000 while puts remain at 600,000, the ratio rises to 1.20. Describing that change as a doubling of put demand would be wrong. The ratio doubled because call volume halved.
A second example illustrates the opposite problem. Put volume could rise from 600,000 to 900,000 while calls rise from 1 million to 1.8 million. The ratio falls from 0.60 to 0.50 despite a 50% increase in put activity. Reading both underlying counts prevents a misleading interpretation of the headline ratio.
Identify which contracts are included
Cboe publishes separate statistics for equity options, index options and other categories. Those groups serve different users and strategies. Index puts may be used to protect a broad portfolio, while options on an individual stock can be dominated by a company-specific event. Their normal trading patterns need not match.
A total-market measure can change because the mixture of categories changes. If index hedging grows relative to single-stock trading, the combined ratio may rise even without a comparable shift inside either group. Compare the same market definition, exchange coverage and observation period before treating two readings as a continuous series.
Volume and open interest are also different. Volume records contracts traded during the period. Open interest concerns contracts outstanding after positions are accounted for. A volume-based ratio cannot tell the reader how much new exposure was created, because opening and closing transactions can both generate trading volume.
A put trade is not automatically a bearish purchase
Every executed option trade has a buyer and a seller. A purchased put can protect an existing stock holding, while a sold put creates a different exposure. Calls can likewise be purchased to seek upside or sold against shares as part of a covered-call position. A contract count does not reconstruct those portfolios.
Consider a hypothetical investor who owns a stock portfolio and buys index puts before an uncertain event. The puts express concern about near-term losses, yet the investor may remain invested for the long term. Calling the entire position a bet that stocks will fall would omit the much larger exposure being protected.
Complex strategies create further ambiguity. A spread can involve several option legs, each adding to reported volume. Trading around exercise decisions can also produce unusually large counts. Cboe has documented how early-exercise-related activity can distort equity put/call statistics, which is one reason to investigate an apparent outlier before assigning a market-wide story to it.
Contract counts do not measure equal amounts of risk
Two options can each count as one contract while differing greatly in price, expiry and sensitivity to the underlying asset. An inexpensive far-out-of-the-money put and a near-the-money call do not represent equivalent cash spending or directional exposure. A simple ratio ignores those differences by design.
That does not make the indicator useless. It means the question must match the measurement. The ratio can show a change in the balance of reported contract activity. Establishing the size and direction of investors' risk requires additional information about trades, positions and hedges that a daily summary may not provide.
Use context instead of a universal trading threshold
A reading above one says puts outnumbered calls in the selected dataset. It does not establish that the market is due to reverse. Historical comparisons should use consistent definitions and allow for changes in products and market participation. An unusually high reading can remain high or reflect activity unrelated to the next day's return.
Read the ratio beside implied volatility, market breadth and the relevant news. A careful account identifies the category, both contract counts and any unusual trading explanation. That produces a useful description of positioning evidence without turning one incomplete indicator into a forecast.
Sources and methodology (3)
Primary references for definitions and methodology. All numerical teaching examples in this article are hypothetical and are not current prices, forecasts or actual company results.
TTN analysis for informational purposes. This article is not investment, tax or legal advice.