US Builder Confidence Falls to Lowest Since 2012
The NAHB index fell to 29 in October as costly mortgages restrained demand. More builders cut prices, putting affordability and margins in focus.
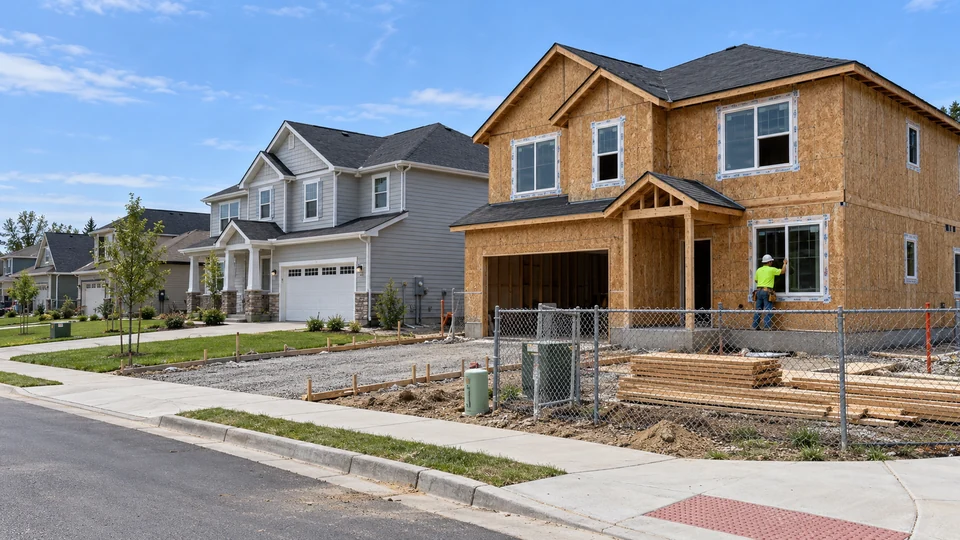
Confidence among US homebuilders fell to its weakest level since June 2012 in October, as expensive mortgages and building costs continued to strain the market for new single-family houses. The NAHB/Wells Fargo Housing Market Index dropped three points to 29, the industry association said Monday.
Price concessions became more widespread. Some 43% of builders reported cutting prices, the largest share in the 2020–2026 period. The average reduction among those cutting prices held at 6%, while 65% reported offering sales incentives.
Demand weakened across the survey
All three components declined. Current sales conditions fell to 33, expectations for the next six months to 32 and prospective-buyer traffic to 18. NAHB said traffic was the weakest since April 2012 when the initial pandemic disruption in April 2020 is excluded.
The index surveys builders’ assessments of sales and traffic. A reading above 50 indicates that more respondents judge conditions favorably than unfavorably. October’s figures measure sentiment about newly built single-family homes; they are not a count of completed transactions or a national house-price index.
Mortgage costs limit purchasing power
Freddie Mac’s latest available weekly survey put the average 30-year fixed mortgage at 7.40% as of October 15, unchanged from the previous week and above 6.27% a year earlier. Its survey focuses on conventional conforming purchase loans for strong-credit borrowers putting 20% down.
That average is a reference point rather than a personalized financing offer. Actual borrowing costs vary with the applicant, loan structure and lender. It also means that a house becoming cheaper does not automatically make the monthly payment affordable to every prospective buyer.
For illustration, a $400,000 loan amortized over 30 years at 7.40% carries principal and interest of roughly $2,770 a month. At 6.27%, the same balance and term imply about $2,468. These are hypothetical calculations excluding property tax, insurance, fees and mortgage insurance. They isolate the effect of the interest rate rather than describing a particular purchase.
Discounts and incentives have different effects
A lower sale price reduces the purchase amount. An incentive may instead help with financing or another part of the transaction. Comparing offers requires examining the complete terms, including whether a benefit expires, what the buyer must pay upfront and how much cash is needed at closing.
For a builder, moving a completed home can release capital tied up in inventory. The economic benefit must be weighed against the revenue given up through a concession and the cost of providing an incentive. The survey does not establish the resulting profit margin at any individual company.
The guide to builder confidence and housing starts explains why a sentiment release and actual construction activity can move on different schedules. Permits, starts, completions and sales each describe a different stage of the market. One weak reading does not determine the next release.
Incentives can obscure the effective selling price
A buyer comparing two new homes needs to compare the complete financing package, not just the advertised price. A mortgage-rate subsidy may lower early payments while an outright discount reduces the purchase amount. Builders can use either approach to support sales, but the effects on margins, loan balances and future household payments differ. The survey does not price those trade-offs for an individual property.
The pressure extends beyond buyers
TTN’s assessment is that the combination of weak traffic and persistent building costs leaves developers with difficult timing decisions. Starting more homes adds future supply but also commits capital. Slowing construction limits that exposure while potentially affecting suppliers and local employment.
The national figures also leave room for substantial variation between markets and companies. Land costs, product mix, inventory age and available financing differ. The average price cut should therefore not be applied mechanically to every listing or used to infer the discount a particular buyer can obtain.
For the next round of builder results, the useful measures will be orders, cancellations, completed inventory and margins after incentives. October’s survey shows broad pressure on confidence and buyer interest. Company disclosures will show how much of that pressure reaches revenue and cash flow.
Sources and methodology (3)
October survey figures were checked against NAHB’s original release. The mortgage rate is Freddie Mac’s national survey average as of October 15, not a live lender quote or a rate available to every borrower. Reuters published its report at 14:05 UTC on October 19. Interpretation and the payment example are TTN analysis.