US Housing Starts Fall 5.2% as Single-Family Permits Weaken
September housing starts declined in the preliminary US estimate, while weaker single-family permits point to a softer construction pipeline.
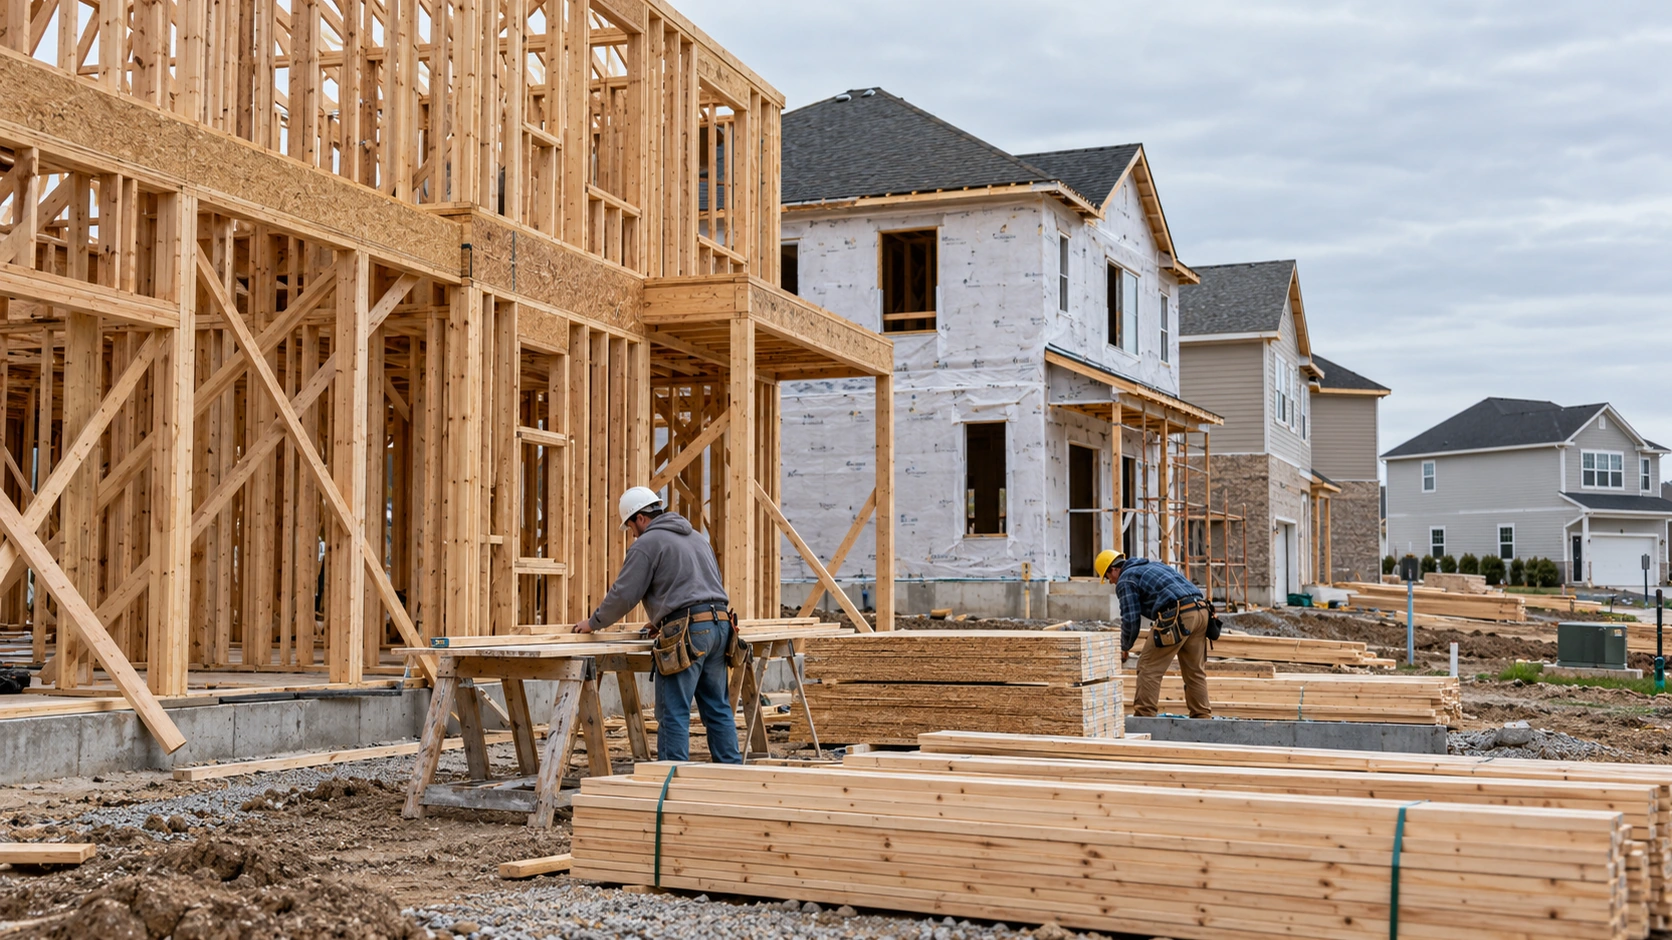
U.S. housing starts fell 5.2% in September to a seasonally adjusted annual rate of 1.221 million units, according to the preliminary Census Bureau and HUD report released Tuesday. Permits for single-family homes also declined, adding a forward-looking sign of caution to the weaker construction estimate.
The headline needs a statistical qualification. The reported monthly fall in total starts has a 90% confidence interval of plus or minus 11.8 percentage points. Because that range includes zero, the survey does not establish that the actual monthly change was a decline. The point estimate is weaker; its precision is limited.
Permits show a softer single-family pipeline
Single-family permits fell 4.0% to an annualized 845,000 units. Total permits were nearly flat, down 0.2% at 1.4 million. The difference matters: the broad authorization figure can obscure changes in the part of the market most directly associated with detached homes.
A permit is permission to build, while a start records construction getting underway. Neither is a completed home sale. Reading them together helps separate the pipeline of potential projects from work already beginning, but it does not establish that every authorized project will proceed.
Borrowing costs constrain the buyer
Reuters linked the weakness in single-family construction to higher mortgage rates and subdued demand. Its report also described an inventory overhang that reduces developers’ incentive to begin new projects. Those pressures help explain why a need for more housing can coexist with weak near-term building activity.
For a household, the binding constraint can be the monthly payment rather than the desire to buy. Higher financing costs reduce the price a buyer can support on the same income. For a builder, selling a home through incentives may preserve volume while reducing the return on that sale. The effect on a particular business depends on its costs, land holdings and local market.
Starts, completions and the homes available to buyers
The same Census release puts housing completions at an annualized 1.192 million units. A completion adds a finished unit, while a start adds a project to the construction pipeline. The two can move differently because finishing a home takes time. A reduction in starts today therefore does not translate into an equal immediate reduction in the number of finished homes available this month.
Annualization also needs care. The 1.221 million figure for starts expresses the pace that would prevail over a year if the seasonally adjusted monthly rate continued. It is not a prediction that exactly that many units will be built, nor does it mean more than a million homes physically began construction in September. Weather, project timing and revisions can change the subsequent estimates.
The report's explanatory notes say that identifying an underlying trend can require several months of data. That is especially relevant when a monthly change has a confidence interval wide enough to include no change. The statistical qualification does not make the survey useless. It directs attention toward the series over time, the more detailed categories and corroborating evidence, rather than a categorical interpretation of one headline.
A national total can also mask local differences. A builder with substantial land holdings in one metropolitan area faces that market's inventories, buyers and construction costs. Its order book can weaken even if another region remains comparatively firm. The national report provides a broad benchmark; company-level results need regional exposure and project information before the same conclusion can be applied to every developer.
For the supply outlook, the sequence matters: authorizations, starts, construction in progress and completions describe different stages. Tracking those stages together can help explain why a slowdown in new projects coexists with continued deliveries from work already underway. None of them directly measures mortgage approvals or the number of purchase contracts signed by households.
One report cannot settle the trend
These preliminary estimates can be revised. Annualized rates express an adjusted pace, rather than a count of homes physically started during September.
Permits deserve attention alongside the volatile starts estimate. A sustained weakening in authorizations would be more consequential for future activity than one uncertain monthly change. Subsequent releases and builders’ orders will help show whether the softer pipeline persists.
Sources and methodology
Sources checked October 20, 2026. Reported facts and company expectations are attributed above; analytical explanations are TTN’s interpretation. The generated cover is illustrative and does not document an actual event or location.